
At a Glance
Data Intelligence Widgets
Architecting scalable, data-driven real estate intelligence experiences across India, UAE, and Canada — combining analytics, visualization systems, SEO scalability, and product-focused frontend engineering.
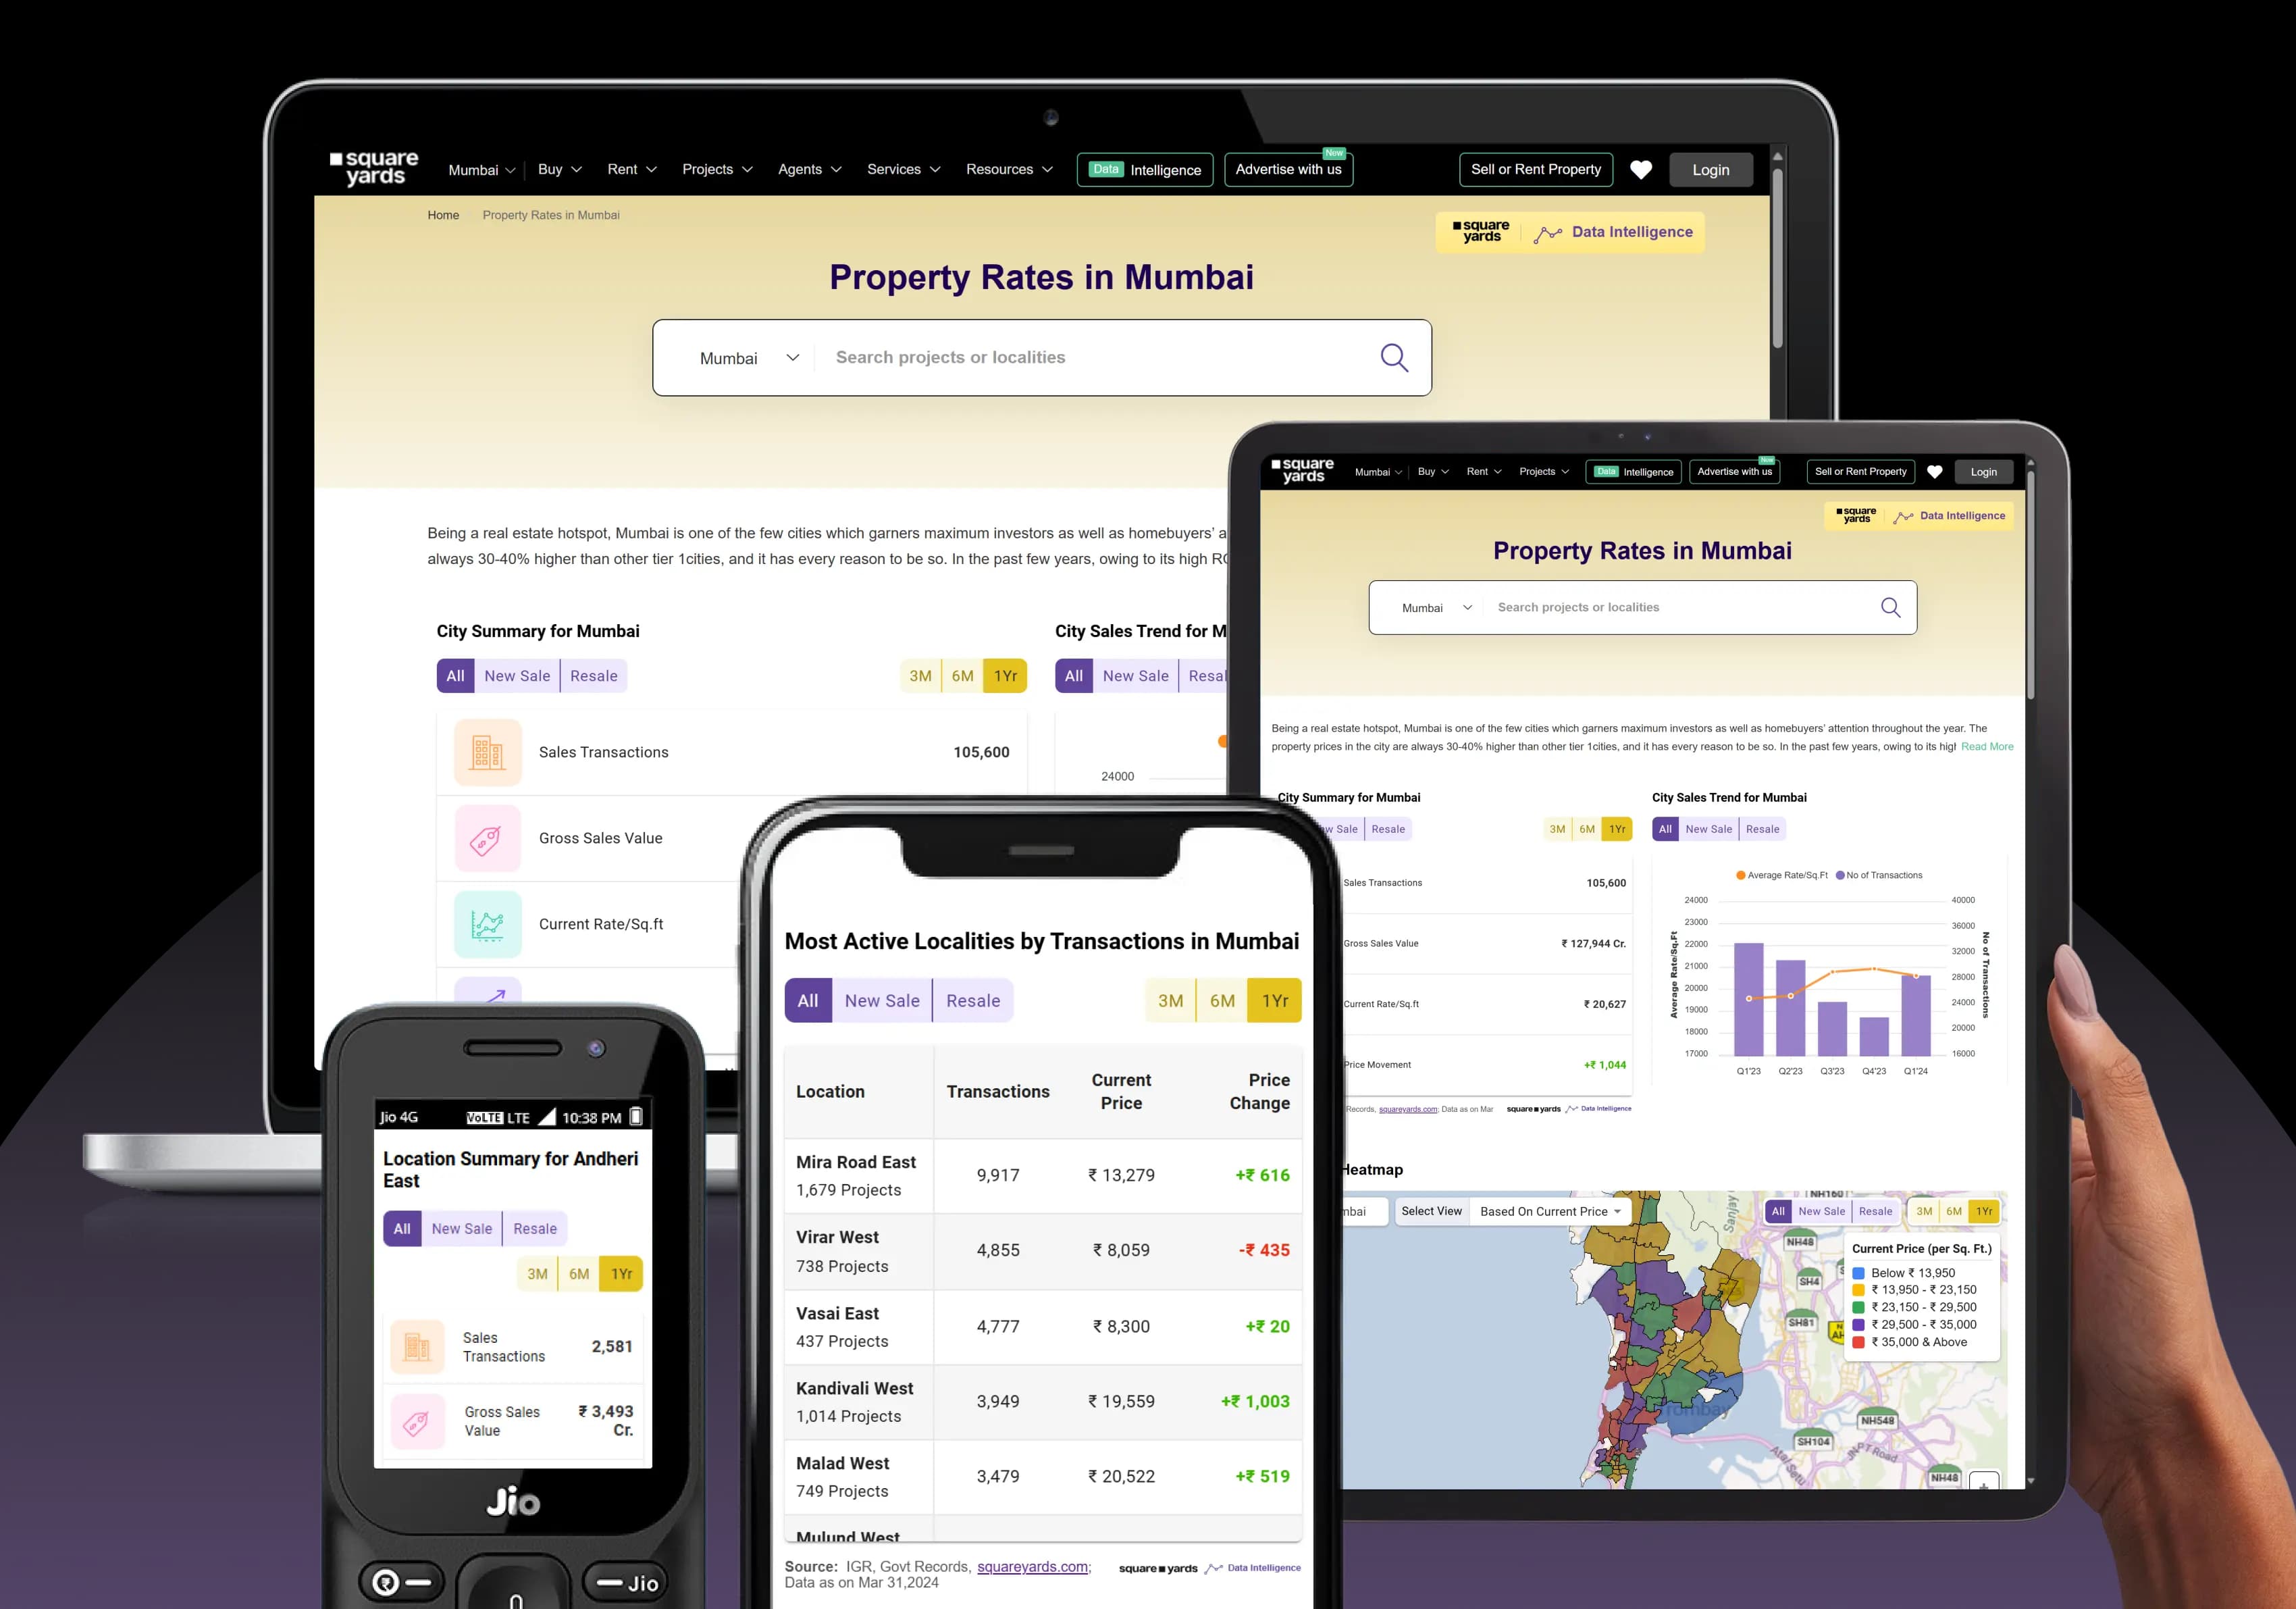
Overview
The Data Intelligence Widgets platform was designed to make large-scale real estate market data easier to explore, understand, and act upon for end users, investors, and businesses.
The platform supports dynamic market insights across multiple geographies and granular levels — from countries and cities to micro-markets, localities, and individual projects.
Built for scale and discoverability, the experience powers millions of SEO-indexed pages while supporting multiple visualization formats including charts, tables, 2D maps, and 3D map experiences.
Project Highlights
The Challenge
Real estate decisions involve massive amounts of fragmented and difficult-to-understand market data.
Most platforms present this information in static, text-heavy, or disconnected formats that make exploration difficult for both casual users and professionals.
The challenge was to build a scalable experience platform that could:
- Simplify large-scale market intelligence
- Handle dynamic geo-based datasets
- Support multiple countries and regions
- Enable SEO discoverability at scale
- Maintain frontend performance despite visualization-heavy experiences
- Allow rapid rollout of new widget types and insights
My Role & Contributions
Architecture & Approach
Technology Stack
Frontend
Visualization
Engineering Focus
[ Image representation of Market Trend Analytics ]
Market Trend Analytics
Interactive visualizations designed to help users understand pricing trends, appreciation patterns, and market movement over time.
Leadership & Team Impact
As part of the engineering leadership responsibilities, I contributed to improving both engineering quality and delivery efficiency.
- Mentoring engineers across frontend technologies
- Establishing reusable engineering patterns
- Improving code modularity and maintainability
- Supporting roadmap planning
- Improving collaboration workflows
- Reducing deployment friction
- Encouraging scalable engineering practices
Outcomes & Impact
The platform evolved into a scalable analytics experience supporting multiple countries and millions of discoverable pages.
- Large-scale SEO visibility
- Scalable frontend foundations
- Faster widget expansion
- Improved maintainability
- Better delivery consistency
- Enhanced user exploration experience
- Reusable visualization systems
- Cross-region scalability
Key Learnings
Building large-scale analytics platforms reinforced the importance of balancing engineering scalability with user clarity.
- Data visualization is as much a UX problem as an engineering problem
- Reusable systems become critical at scale
- Product thinking improves technical decision-making
- Frontend architecture directly affects delivery velocity
- Scalability requires long-term thinking, not short-term feature delivery
- Collaboration quality significantly impacts engineering outcomes
Your Ideas Need Great Execution
Skip the agency bloat. Ship your complete digital experience in one shop.
or 👈
No pressure. No obligation. Just clear next steps.